


Palantir Technologies (PLTR) was a “talked-about” stock shortly after its initial public offering (IPO) in September 2020. The stock reached a high of $45 in January 2021 and headed lower, trading sideways until about November 2021. From there, the stock price kept falling.
CHART 1: WEEKLY CHART OF PALANTIR TECHNOLOGIES (PLTR). The stock has been trending lower after reaching an all-time high of $45. Will the stock reach $45 again or stall?Chart source: StockCharts.com. For educational purposes.
The stock reached a low in December 2022. It has started showing signs of life, although it has been an up and down journey. The stock is now hitting new 52-week highs.
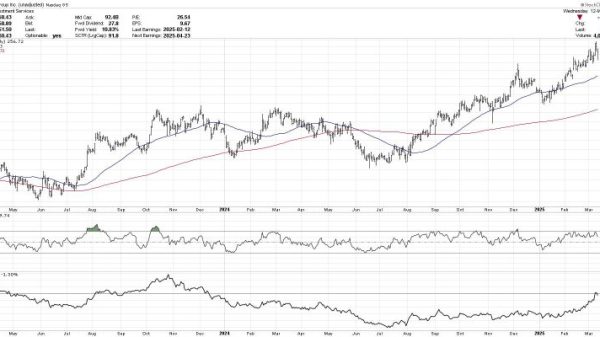
CHART 2: DAILY CHART OF PLTR. The stock is trending higher, trading above its 21-day exponential moving average (EMA). PLTR also has a very high StockCharts Technical Rank (SCTR) score, and the percentage price oscillator is in positive territory. The stock has momentum that’s pushing the stock higher. How much higher will it go?Chart source: StockCharts.com. For educational purposes.
The above chart shows the following points worth noting:
StockCharts Technical Rank (SCTR) score has been consistently above 90 since May 2023.PLTR stock has been trading above its 21-day exponential moving average (EMA) since the price gapped up on November 2, 2023.The percentage price oscillator (PPO) is in positive territory, indicating bullish momentum.
How To Scan for Stocks Hitting 52-Week Highs
You can scan for stocks hitting new 52-week highs using the New 52-Week Highs scan from the StockCharts Sample Scan Library. From Your Dashboard or Charts & Tools tab, scroll to the Sample Scan Library and run the New 52-Week Highs scan. The scan will filter out all the stocks and ETFs that meet the scan criteria.
How high can the stock go? Theoretically, it could reach its all-time high of $45, but it may not necessarily be smooth sailing. Looking at the weekly chart, PLTR could hit resistance around the $26–$29 level. If the stock price is able to break above this level, the next resistance could be anywhere from $37–$45.
Why is scanning for stocks that are hitting new 52-week highs important? It goes back to the strategy of legendary stock trader Jesse Livermore. One of Livermore’s criteria was to identify stocks that are breaking out on a new high. It meant the stock had overcome a resistance level and was likely to move higher. But the stock needs momentum. Without it, the stock price could fall back to its 21-day EMA.
The bottom line: It’s worth running the New 52-Week Highs scan on a regular basis and going through the charts of the stocks and ETFs that meet the criteria. Look for the momentum by looking at an indicator like the PPO and watching trading volume. Volume needs to be strong to push the price higher.
Disclaimer: This blog is for educational purposes only and should not be construed as financial advice. The ideas and strategies should never be used without first assessing your own personal and financial situation, or without consulting a financial professional.