


SPX Monitoring purposes: Sold SPX Oct. 18, 2023, at 4314.60 gain 0.35%; Long SPX Sept. 28, 2023 at 4299.70.
Gain since Dec 20, 2022 = 16.30%.
Monitoring purposes GOLD: Long GDX on Oct. 9, 2020, at 40.78.
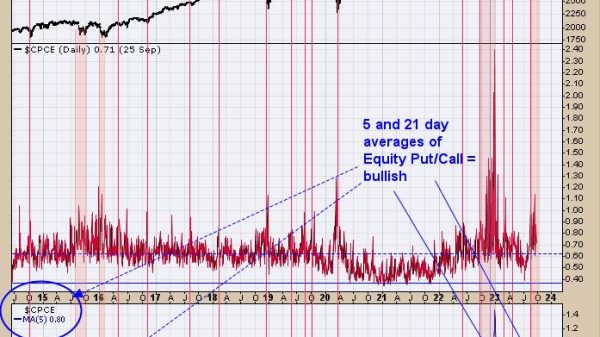
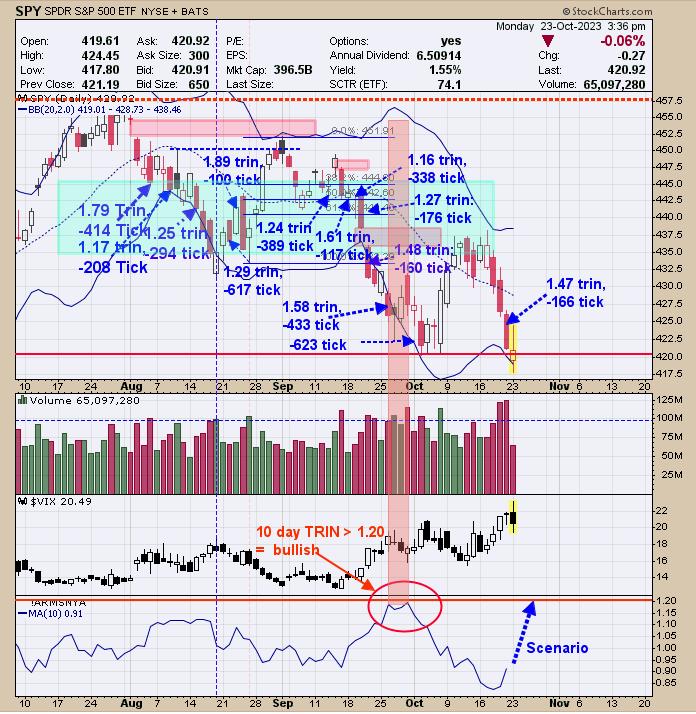
In the chart above, the bottom window displays the 10-day moving average of the Short-Term Trading Arms Index TRIN ($TRIN) and the top window is the daily chart of SPDR S&P 500 ETF (SPY). In the coming days, we would like to see the 10-day TRIN rally back to panic levels near 1.20 or higher; as we have said, panic forms near lows in the market. We labeled in blue the times when the TRIN and $TICK readings reached bullish levels; on Friday, TRIN closed at 1.46 (bullish), and TICK closed at -166 (leans bullish). Today, the SPY was down five days in a row, which predicts the market will be lower 83% of the time within five days. The bottom may not be far off.
Join me on TFNN.com Tuesday at 3:30 Eastern; Thursday at 3:20 Eastern, Tune in.
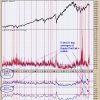
Above is the daily VVIX/VIX ratio. You see a positive divergence. At a reversal in the SPY, it’s common for the $VVIX/$VIX ratio to produce a divergence. The chart above goes back to February and shows the times when SPY made lower lows, and the VIX/VVIX ratio made higher lows (positive divergence; blue squares) and the times when SPY made higher highs and the VIX/VVIX ratio made lower highs (bearish divergence; red square). We did have a bullish TRIN close on Friday of 1.47 and a somewhat bullish TICK close of -166. Also worth noting is that the market is near the 420 SPY support. We do have bullish signs but no bullish trigger. Staying neutral for now.
Join us at @OrdOracle
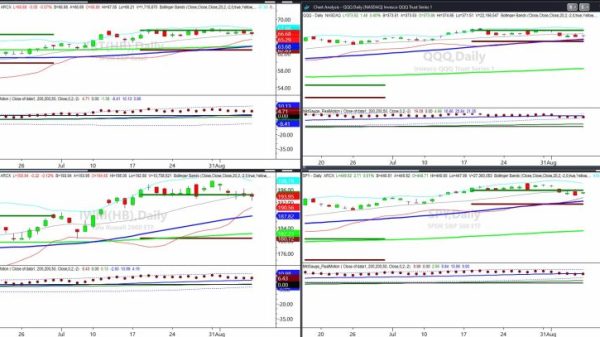
The top window in the above chart is the weekly GDX graph. The next lower window is the weekly cumulative GDX Up-Down Volume Percent, and the next lower window is the weekly cumulative GDX Advance-Decline Volume Percent. This chart goes back nearly two years. We added the Bollinger Bands to the bottom two indicators. Bullish and bearish signals are triggered for GDX when either or both indicators close above (bullish) or below (bearish) their mid-Bollinger bands. The red dotted lines on the chart above are when a bearish signal is triggered, and the dotted blue lines are when a bullish signal is triggered. Last week, both indicators closed above their mid-Bollinger bands, triggering a buy signal. The signal usually lasts two to six months.
Tim Ord,
Editor
www.ord-oracle.com. Book release “The Secret Science of Price and Volume” by Timothy Ord, buy at www.Amazon.com.
Signals are provided as general information only and are not investment recommendations. You are responsible for your own investment decisions. Past performance does not guarantee future performance. Opinions are based on historical research and data believed reliable; there is no guarantee results will be profitable. Not responsible for errors or omissions. I may invest in the vehicles mentioned above.