


I like analogues, and, for that matter, just about anything which can give me the answers ahead of time. That said, pure pattern analogues are problematic, and every one of them that I have ever studied has eventually broken correlation, and so one must be aware that such an outcome could happen at any time.
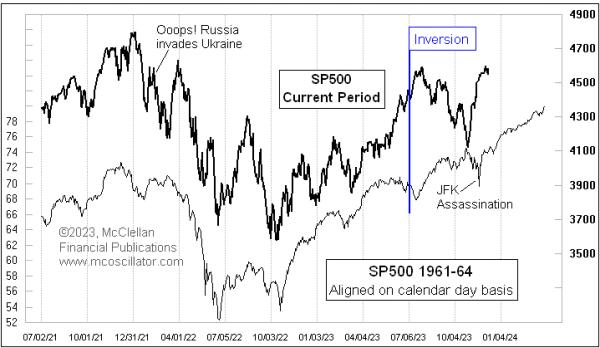
This week’s chart shows a special type of analogue, meaning that it is not based solely upon noticing a price pattern correlation. The current plot and that from 1961-64 are aligned on a calendar day basis, which adds additional legitimacy to the pattern comparison. Both plots reflect how the market behaves during the same portions of the 4-year Presidential Cycle Pattern.
That pattern involves an important low in the second year of the presidential term, which, for this comparison, was 1962 and 2022. The third year is nearly always an up year, which it was in 1963, and was again in 2023. But there is a big recent difference in the two plots’ behavior.
The correlation was working really tightly up until July 2023, when an inversion happened. Ever since then, the 2023 plot has been moving step for step in opposition to the one from 1963. That includes the November 2023 rally, which was opposite to the market decline in November 1963, even before the bears got an additional kicker from the assassination of President Kennedy.
That dip in late November 1963 quickly reversed, and its echo in 2023 seems to be the entry into a sideways pause. The question now is whether the current pattern will stay inverted from that of 1963, or whether the forces behind the 4-year Presidential Cycle Pattern are going to work their magic and get the current market back into form again.
There was a similar but shorter inversion earlier in this chart. When Russia invaded Ukraine, the stock market fell hard, which was not what we saw at the same point in 1962. The two patterns danced in opposition for a while, but eventually got back into sync again by April 2022. So the likelihood is that this current inversion will also disinvert and get back to the 1963 pattern. In fact, it may already have done that reversion.